SEMI-SUPERVISED CLASSIFICATION WITH GRAPH CONVOLUTIONAL NETWORKS
RESULTS
6.1 SEMI-SUPERVISED NODE CLASSIFICATION
Results are summarized in Table 2. Reported numbers denote classification accuracy in percent. For ICA, we report the mean accuracy of 100 runs with random node orderings. Results for all other baseline methods are taken from the Planetoid paper (Yang et al., 2016). Planetoid* denotes the best model for the respective dataset out of the variants presented in their paper.
Table 2: Summary of results in terms of classification accuracy (in percent).
| Method | Citeseer | Cora | Pubmed | NELL |
|---|---|---|---|---|
| ManiReg [3] | 60.1 | 59.5 | 70.7 | 21.8 |
| SemiEmb [28] | 59.6 | 59.0 | 71.1 | 26.7 |
| LP [32] | 45.3 | 68.0 | 63.0 | 26.5 |
| DeepWalk [22] | 43.2 | 67.2 | 65.3 | 58.1 |
| ICA [18] | 69.1 | 75.1 | 73.9 | 23.1 |
| Planetoid* [29] | 64.7 (26s) | 75.7 (13s) | 77.2 (25s) | 61.9 (185s) |
| GCN (this paper) | 70.3 (7s) | 81.5 (4s) | 79.0 (38s) | 66.0 (48s) |
| GCN (rand. splits) | 67.9 ± 0.5 | 80.1 ± 0.5 | 78.9 ± 0.7 | 58.4 ± 1.7 |
We further report wall-clock training time in seconds until convergence (in brackets) for our method (incl. evaluation of validation error) and for Planetoid. For the latter, we used an implementation provided by the authors3and trained on the same hardware (with GPU) as our GCN model. We trained and tested our model on the same dataset splits as in Yang et al. (2016) and report mean accuracy of 100 runs with random weight initializations. We used the following sets of hyperparameters for Citeseer, Cora and Pubmed: 0.5 (dropout rate), $5 \cdot 1 0 ^ { - 4 }$ (L2 regularization) and 16 (number of hidden units); and for NELL: 0.1 (dropout rate), $1 \cdot 1 0 ^ { - 5 }$ (L2 regularization) and 64 (number of hidden units).
In addition, we report performance of our model on 10 randomly drawn dataset splits of the same size as in Yang et al. (2016), denoted by GCN (rand. splits). Here, we report mean and standard error of prediction accuracy on the test set split in percent.
6.2 EVALUATION OF PROPAGATION MODEL
We compare different variants of our proposed per-layer propagation model on the citation network datasets. We follow the experimental set-up described in the previous section. Results are summarized in Table 3. The propagation model of our original GCN model is denoted by renormalization trick (in bold). In all other cases, the propagation model of both neural network layers is replaced with the model specified under propagation model. Reported numbers denote mean classification accuracy for 100 repeated runs with random weight matrix initializations. In case of multiple variables $\Theta _ { i }$ per layer, we impose L2 regularization on all weight matrices of the first layer.
Table 3: Comparison of propagation models.
| Description | Propagation model | Citeseer | Cora | Pubmed | |
| Chebyshev filter (Eq. 5) | $K = 3$ | $\sum_{k=0}^{K} T_k(\tilde{L})X\Theta_k$ | 69.8 | 79.5 | 74.4 |
| $K = 2$ | 69.6 | 81.2 | 73.8 | ||
| $1^{st}$ -order model (Eq. 6) | $X\Theta_0 + D^{-\frac{1}{2}}AD^{-\frac{1}{2}}X\Theta_1$ | 68.3 | 80.0 | 77.5 | |
| Single parameter (Eq. 7) | $(I_N + D^{-\frac{1}{2}}AD^{-\frac{1}{2}})X\Theta$ | 69.3 | 79.2 | 77.4 | |
| Renormalization trick (Eq. 8) | $\tilde{D}^{-\frac{1}{2}}\tilde{A}\tilde{D}^{-\frac{1}{2}}X\Theta$ | 70.3 | 81.5 | 79.0 | |
| $1^{st}$ -order term only | $D^{-\frac{1}{2}}AD^{-\frac{1}{2}}X\Theta$ | 68.7 | 80.5 | 77.8 | |
| Multi-layer perceptron | $X\Theta$ | 46.5 | 55.1 | 71.4 | |
3https://github.com/kimiyoung/planetoid
6.3 TRAINING TIME PER EPOCH
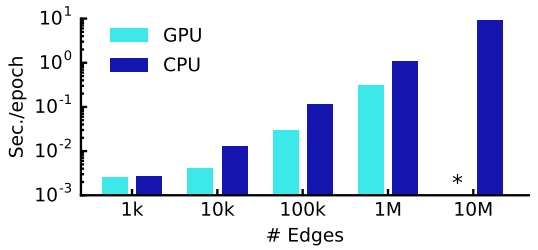
Here, we report results for the mean training time per epoch (forward pass, cross-entropy calculation, backward pass) for 100 epochs on simulated random graphs, measured in seconds wall-clock time. See Section 5.1 for a detailed description of the random graph dataset used in these experiments. We compare results on a GPU and on a CPU-only implementation4in TensorFlow (Abadi et al., 2015). Figure 2 summarizes the results.
bar
| # Edges | GPU (Sec./epoch) | CPU (Sec./epoch) |
|---|---|---|
| 1k | ~0.0025 | ~0.003 |
| 10k | ~0.004 | ~0.012 |
| 100k | ~0.03 | ~0.1 |
| 1M | ~0.3 | ~1 |
| 10M | — | ~8 |
Figure 2: Wall-clock time per epoch for random graphs. (*) indicates out-of-memory error.
7 DISCUSSION
7.1 SEMI-SUPERVISED MODEL
In the experiments demonstrated here, our method for semi-supervised node classification outperforms recent related methods by a significant margin. Methods based on graph-Laplacian regularization (Zhu et al., 2003; Belkin et al., 2006; Weston et al., 2012) are most likely limited due to their assumption that edges encode mere similarity of nodes. Skip-gram based methods on the other hand are limited by the fact that they are based on a multi-step pipeline which is difficult to optimize. Our proposed model can overcome both limitations, while still comparing favorably in terms of efficiency (measured in wall-clock time) to related methods. Propagation of feature information from neighboring nodes in every layer improves classification performance in comparison to methods like ICA (Lu & Getoor, 2003), where only label information is aggregated.
We have further demonstrated that the proposed renormalized propagation model (Eq. 8) offers both improved efficiency (fewer parameters and operations, such as multiplication or addition) and better predictive performance on a number of datasets compared to a na¨ıve 1st-order model (Eq. 6) or higher-order graph convolutional models using Chebyshev polynomials (Eq. 5).
7.2 LIMITATIONS AND FUTURE WORK
Here, we describe several limitations of our current model and outline how these might be overcome in future work.
Memory requirement In the current setup with full-batch gradient descent, memory requirement grows linearly in the size of the dataset. We have shown that for large graphs that do not fit in GPU memory, training on CPU can still be a viable option. Mini-batch stochastic gradient descent can alleviate this issue. The procedure of generating mini-batches, however, should take into account the number of layers in the GCN model, as the $K ^ { \mathrm { t h } }$ -order neighborhood for a GCN with K layers has to be stored in memory for an exact procedure. For very large and densely connected graph datasets, further approximations might be necessary.
Directed edges and edge features Our framework currently does not naturally support edge features and is limited to undirected graphs (weighted or unweighted). Results on NELL however show that it is possible to handle both directed edges and edge features by representing the original directed graph as an undirected bipartite graph with additional nodes that represent edges in the original graph (see Section 5.1 for details).
Limiting assumptions Through the approximations introduced in Section 2, we implicitly assume locality (dependence on the $K ^ { \check { \mathrm { t h } } }$ -order neighborhood for a GCN with K layers) and equal importance of self-connections vs. edges to neighboring nodes. For some datasets, however, it might be beneficial to introduce a trade-off parameter λ in the definition of $\tilde { A } ;$
$$ \tilde {A} = A + \lambda I _ {N}. \tag {11} $$
4Hardware used: 16-core IntelR XeonR CPU E5-2640 v3 @ 2.60GHz, GeForceR GTX TITAN X
This parameter now plays a similar role as the trade-off parameter between supervised and unsupervised loss in the typical semi-supervised setting (see Eq. 1). Here, however, it can be learned via gradient descent.
8 CONCLUSION
We have introduced a novel approach for semi-supervised classification on graph-structured data. Our GCN model uses an efficient layer-wise propagation rule that is based on a first-order approximation of spectral convolutions on graphs. Experiments on a number of network datasets suggest that the proposed GCN model is capable of encoding both graph structure and node features in a way useful for semi-supervised classification. In this setting, our model outperforms several recently proposed methods by a significant margin, while being computationally efficient.
ACKNOWLEDGMENTS
We would like to thank Christos Louizos, Taco Cohen, Joan Bruna, Zhilin Yang, Dave Herman, Pramod Sinha and Abdul-Saboor Sheikh for helpful discussions. This research was funded by SAP.
REFERENCES
- Mart´ın Abadi et al. TensorFlow: Large-scale machine learning on heterogeneous systems, 2015.
- James Atwood and Don Towsley. Diffusion-convolutional neural networks. In Advances in neural information processing systems (NIPS), 2016.
- Mikhail Belkin, Partha Niyogi, and Vikas Sindhwani. Manifold regularization: A geometric framework for learning from labeled and unlabeled examples. Journal of machine learning research (JMLR), 7(Nov):2399–2434, 2006.
- Ulrik Brandes, Daniel Delling, Marco Gaertler, Robert Gorke, Martin Hoefer, Zoran Nikoloski, and Dorothea Wagner. On modularity clustering. IEEE Transactions on Knowledge and Data Engineering, 20(2):172–188, 2008.
- Joan Bruna, Wojciech Zaremba, Arthur Szlam, and Yann LeCun. Spectral networks and locally connected networks on graphs. In International Conference on Learning Representations (ICLR), 2014.
- Andrew Carlson, Justin Betteridge, Bryan Kisiel, Burr Settles, Estevam R. Hruschka Jr, and Tom M. Mitchell. Toward an architecture for never-ending language learning. In AAAI, volume 5, pp. 3, 2010.
- Michael Defferrard, Xavier Bresson, and Pierre Vandergheynst. Convolutional neural networks on ¨ graphs with fast localized spectral filtering. In Advances in neural information processing systems (NIPS), 2016.
- Brendan L. Douglas. The Weisfeiler-Lehman method and graph isomorphism testing. arXiv preprint arXiv:1101.5211, 2011.
- David K. Duvenaud, Dougal Maclaurin, Jorge Iparraguirre, Rafael Bombarell, Timothy Hirzel, Alan´ Aspuru-Guzik, and Ryan P. Adams. Convolutional networks on graphs for learning molecular fingerprints. In Advances in neural information processing systems (NIPS), pp. 2224–2232, 2015.
- Xavier Glorot and Yoshua Bengio. Understanding the difficulty of training deep feedforward neural networks. In AISTATS, volume 9, pp. 249–256, 2010.
- Marco Gori, Gabriele Monfardini, and Franco Scarselli. A new model for learning in graph domains. In Proceedings. 2005 IEEE International Joint Conference on Neural Networks., volume 2, pp. 729–734. IEEE, 2005.
- Aditya Grover and Jure Leskovec. node2vec: Scalable feature learning for networks. In Proceedings of the 22nd ACM SIGKDD International Conference on Knowledge Discovery and Data Mining. ACM, 2016.
- David K. Hammond, Pierre Vandergheynst, and Remi Gribonval. Wavelets on graphs via spectral ´ graph theory. Applied and Computational Harmonic Analysis, 30(2):129–150, 2011.
- Kaiming He, Xiangyu Zhang, Shaoqing Ren, and Jian Sun. Deep residual learning for image recognition. In IEEE Conference on Computer Vision and Pattern Recognition (CVPR), 2016.
- Thorsten Joachims. Transductive inference for text classification using support vector machines. In International Conference on Machine Learning (ICML), volume 99, pp. 200–209, 1999.
- Diederik P. Kingma and Jimmy Lei Ba. Adam: A method for stochastic optimization. In International Conference on Learning Representations (ICLR), 2015.
- Yujia Li, Daniel Tarlow, Marc Brockschmidt, and Richard Zemel. Gated graph sequence neural networks. In International Conference on Learning Representations (ICLR), 2016.
- Qing Lu and Lise Getoor. Link-based classification. In International Conference on Machine Learning (ICML), volume 3, pp. 496–503, 2003.
- Laurens van der Maaten and Geoffrey Hinton. Visualizing data using t-sne. Journal of Machine Learning Research (JMLR), 9(Nov):2579–2605, 2008.
- Tomas Mikolov, Ilya Sutskever, Kai Chen, Greg S. Corrado, and Jeff Dean. Distributed representations of words and phrases and their compositionality. In Advances in neural information processing systems (NIPS), pp. 3111–3119, 2013.
- Mathias Niepert, Mohamed Ahmed, and Konstantin Kutzkov. Learning convolutional neural networks for graphs. In International Conference on Machine Learning (ICML), 2016.
- Bryan Perozzi, Rami Al-Rfou, and Steven Skiena. Deepwalk: Online learning of social representations. In Proceedings of the 20th ACM SIGKDD international conference on Knowledge discovery and data mining, pp. 701–710. ACM, 2014.
- Franco Scarselli, Marco Gori, Ah Chung Tsoi, Markus Hagenbuchner, and Gabriele Monfardini. The graph neural network model. IEEE Transactions on Neural Networks, 20(1):61–80, 2009.
- Prithviraj Sen, Galileo Namata, Mustafa Bilgic, Lise Getoor, Brian Galligher, and Tina Eliassi-Rad. Collective classification in network data. AI magazine, 29(3):93, 2008.
- Nitish Srivastava, Geoffrey E. Hinton, Alex Krizhevsky, Ilya Sutskever, and Ruslan Salakhutdinov. Dropout: a simple way to prevent neural networks from overfitting. Journal of Machine Learning Research (JMLR), 15(1):1929–1958, 2014.
- Jian Tang, Meng Qu, Mingzhe Wang, Ming Zhang, Jun Yan, and Qiaozhu Mei. Line: Large-scale information network embedding. In Proceedings of the 24th International Conference on World Wide Web, pp. 1067–1077. ACM, 2015.
- Boris Weisfeiler and A. A. Lehmann. A reduction of a graph to a canonical form and an algebra arising during this reduction. Nauchno-Technicheskaya Informatsia, 2(9):12–16, 1968.
- Jason Weston, Fred´ eric Ratle, Hossein Mobahi, and Ronan Collobert. Deep learning via semi- ´ supervised embedding. In Neural Networks: Tricks of the Trade, pp. 639–655. Springer, 2012.
- Zhilin Yang, William Cohen, and Ruslan Salakhutdinov. Revisiting semi-supervised learning with graph embeddings. In International Conference on Machine Learning (ICML), 2016.
- Wayne W. Zachary. An information flow model for conflict and fission in small groups. Journal of anthropological research, pp. 452–473, 1977.
- Dengyong Zhou, Olivier Bousquet, Thomas Navin Lal, Jason Weston, and Bernhard Scholkopf. ¨ Learning with local and global consistency. In Advances in neural information processing systems (NIPS), volume 16, pp. 321–328, 2004.
- Xiaojin Zhu, Zoubin Ghahramani, and John Lafferty. Semi-supervised learning using gaussian fields and harmonic functions. In International Conference on Machine Learning (ICML), volume 3, pp. 912–919, 2003.
A RELATION TO WEISFEILER-LEHMAN ALGORITHM
A neural network model for graph-structured data should ideally be able to learn representations of nodes in a graph, taking both the graph structure and feature description of nodes into account. A well-studied framework for the unique assignment of node labels given a graph and (optionally) discrete initial node labels is provided by the 1-dim Weisfeiler-Lehman (WL-1) algorithm (Weisfeiler & Lehmann, 1968):
Algorithm 1: WL-1 algorithm (Weisfeiler & Lehmann, 1968)
Here, $h _ { i } ^ { ( t ) }$ denotes the coloring (label assignment) of node $v _ { i }$ (at iteration t) and $\mathcal { N } _ { i }$ is its set of neighboring node indices (irrespective of whether the graph includes self-connections for every node or not). hash(·) is a hash function. For an in-depth mathematical discussion of the WL-1 algorithm see, e.g., Douglas (2011).
We can replace the hash function in Algorithm 1 with a neural network layer-like differentiable function with trainable parameters as follows:
$$ h _ {i} ^ {(l + 1)} = \sigma \left(\sum_ {j \in \mathcal {N} _ {i}} \frac {1}{c _ {i j}} h _ {j} ^ {(l)} W ^ {(l)}\right), \tag {12} $$
where $c _ { i j }$ is an appropriately chosen normalization constant for the edge $( v _ { i } , v _ { j } )$ . Further, we can take $h _ { i } ^ { ( l ) }$ now to be a vector of activations of node i in the $l ^ { \mathrm { t h } }$ neural network layer. $W ^ { ( l ) }$ is a layer-specific weight matrix and $\sigma ( \cdot )$ denotes a differentiable, non-linear activation function.
By choosing $c _ { i j } = \sqrt { d _ { i } d _ { j } }$ , where $d _ { i } = | \mathcal { N } _ { i } |$ denotes the degree of node $v _ { i } ,$ we recover the propagation rule of our Graph Convolutional Network (GCN) model in vector form (see Eq. 2)5.
This—loosely speaking—allows us to interpret our GCN model as a differentiable and parameterized generalization of the 1-dim Weisfeiler-Lehman algorithm on graphs.
A.1 NODE EMBEDDINGS WITH RANDOM WEIGHTS
From the analogy with the Weisfeiler-Lehman algorithm, we can understand that even an untrained GCN model with random weights can serve as a powerful feature extractor for nodes in a graph. As an example, consider the following 3-layer GCN model:
$$ Z = \tanh \Big (\hat {A} \tanh \Big (\hat {A} \tanh \Big (\hat {A} X W ^ {(0)} \Big) W ^ {(1)} \Big) W ^ {(2)} \Big), \tag {13} $$
with weight matrices $W ^ { ( l ) }$ initialized at random using the initialization described in Glorot & Bengio (2010). Â, X and $Z$ are defined as in Section 3.1.
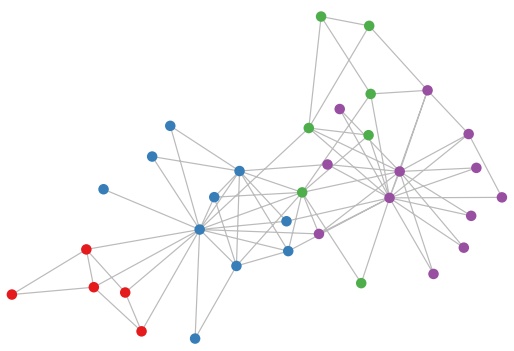
We apply this model on Zachary’s karate club network (Zachary, 1977). This graph contains 34 nodes, connected by 154 (undirected and unweighted) edges. Every node is labeled by one of four classes, obtained via modularity-based clustering (Brandes et al., 2008). See Figure 3a for an illustration.
5Note that we here implicitly assume that self-connections have already been added to every node in the graph (for a clutter-free notation).
flowchart
This image displays a directed graph structure with multiple nodes colored by category, showing connections between them.
(a) Karate club network
scatter
| Series | X (range) | Y (range) |
|---|---|---|
| Purple | -0.15~-0.06 | -0.08~-0.02 |
| Green | -0.09~-0.04 | -0.05~-0.02 |
| Blue | -0.07~0.00 | -0.09~-0.01 |
| Red | 0.02~0.06 | -0.15~-0.11 |
(b) Random weight embedding
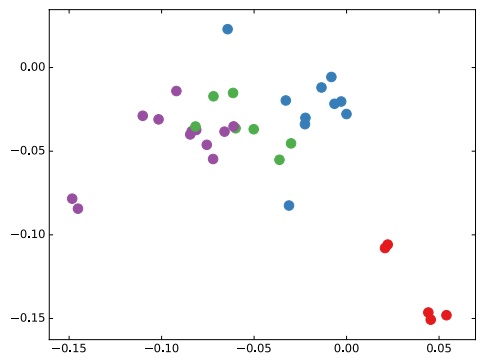
Figure 3: Left: Zachary’s karate club network (Zachary, 1977), colors denote communities obtained via modularity-based clustering (Brandes et al., 2008). $R i g h t { : }$ Embeddings obtained from an untrained 3-layer GCN model (Eq. 13) with random weights applied to the karate club network. Best viewed on a computer screen.
We take a featureless approach by setting $X = I _ { N }$ , where $I _ { N }$ is the N by N identity matrix. N is the number of nodes in the graph. Note that nodes are randomly ordered (i.e. ordering contains no information). Furthermore, we choose a hidden layer dimensionality6 of 4 and a two-dimensional output (so that the output can immediately be visualized in a 2-dim plot).
Figure 3b shows a representative example of node embeddings (outputs Z) obtained from an untrained GCN model applied to the karate club network. These results are comparable to embeddings obtained from DeepWalk (Perozzi et al., 2014), which uses a more expensive unsupervised training procedure.
A.2 SEMI-SUPERVISED NODE EMBEDDINGS
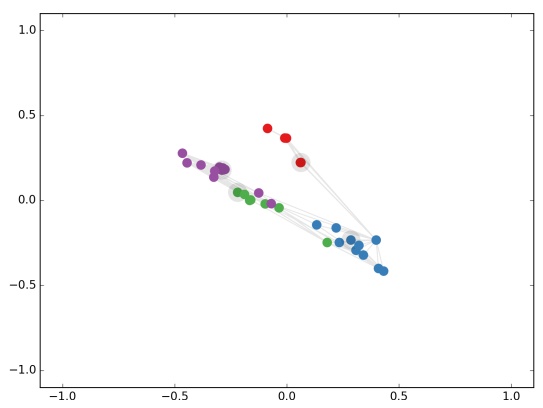
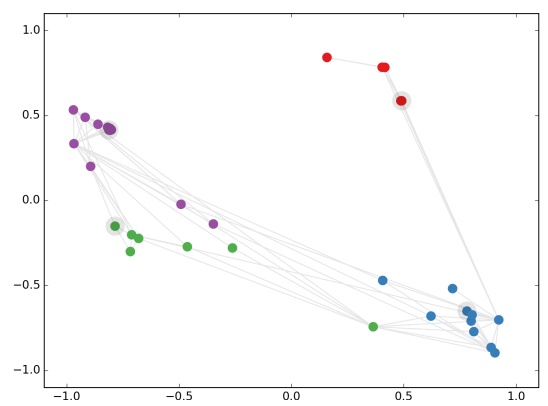
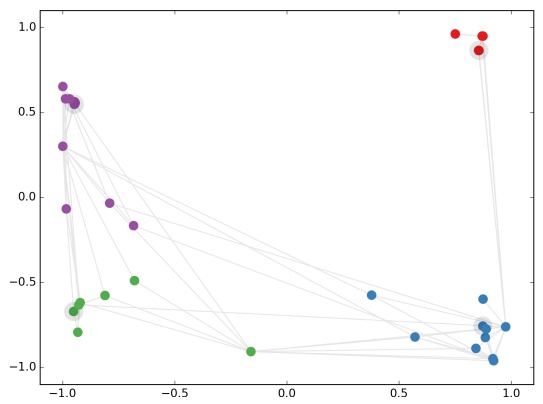
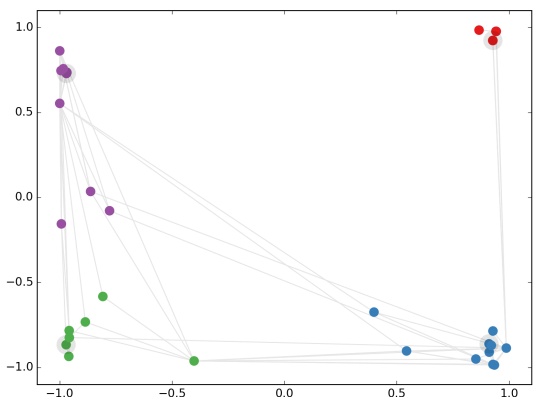
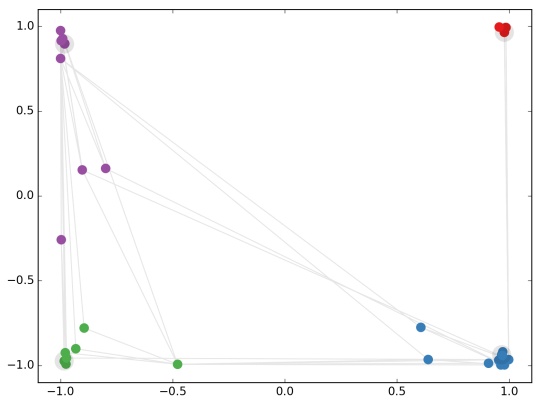
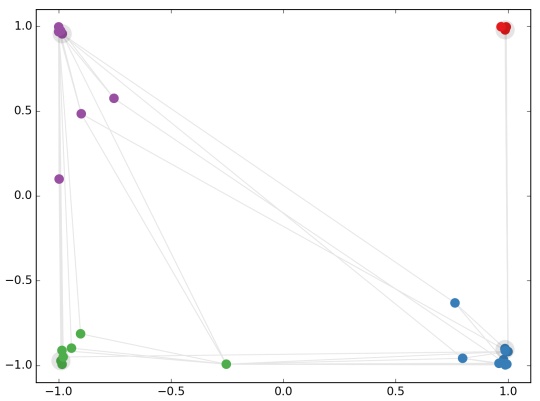
On this simple example of a GCN applied to the karate club network it is interesting to observe how embeddings react during training on a semi-supervised classification task. Such a visualization (see Figure 4) provides insights into how the GCN model can make use of the graph structure (and of features extracted from the graph structure at later layers) to learn embeddings that are useful for a classification task.
We consider the following semi-supervised learning setup: we add a softmax layer on top of our model (Eq. 13) and train using only a single labeled example per class (i.e. a total number of 4 labeled nodes). We train for 300 training iterations using Adam (Kingma & Ba, 2015) with a learning rate of 0.01 on a cross-entropy loss.
Figure 4 shows the evolution of node embeddings over a number of training iterations. The model succeeds in linearly separating the communities based on minimal supervision and the graph structure alone. A video of the full training process can be found on our website7.
6We originally experimented with a hidden layer dimensionality of 2 (i.e. same as output layer), but observed that a dimensionality of 4 resulted in less frequent saturation of tanh(·) units and therefore visually more pleasing results.
7http://tkipf.github.io/graph-convolutional-networks/
scatter
| Series | X (range) | Y (range) |
|---|---|---|
| Red | -0.1~0.1 | 0.2~0.4 |
| Purple | -0.5~-0.1 | 0.1~0.3 |
| Green | -0.3~-0.05 | -0.05~0.05 |
| Blue | 0.1~0.5 | -0.4~ -0.1 |
(a) Iteration 25
scatter
| Series | X (range) | Y (range) |
|---|---|---|
| Red | 0.15~0.50 | 0.60~0.85 |
| Purple | -1.00~-0.30 | -0.15~0.55 |
| Green | -0.80~-0.25 | -0.30~-0.15 |
| Blue | 0.40~0.95 | -0.90~-0.45 |
(b) Iteration 50
scatter
| Series | X (range) | Y (range) |
|---|---|---|
| Red | 0.75~0.95 | 0.85~0.95 |
| Blue | -1.0~1.0 | -0.95~-0.6 |
| Green | -1.0~-0.15 | -0.8~0.55 |
| Purple | -1.0~-0.7 | -0.1~0.65 |
(c) Iteration 75
scatter
| Series | X (range) | Y (range) |
|---|---|---|
| Red | 0.85~1.0 | 0.9~1.0 |
| Blue | -1.0~1.0 | -1.0~-0.7 |
| Green | -1.0~-0.4 | -0.9~-0.6 |
| Purple | -1.0~-0.8 | -0.2~0.9 |
(d) Iteration 100
scatter
| Series | X (range) | Y (range) |
|---|---|---|
| Red | 0.95~1.0 | 0.95~1.0 |
| Purple | -1.0~-0.8 | 0.15~0.95 |
| Blue | 0.6~1.0 | -1.0~-0.8 |
| Green | -1.0~-0.5 | -1.0~-0.8 |
| Dark Green | -1.0~-0.95 | -1.0~-0.95 |
(e) Iteration 200
scatter
| Series | X (range) | Y (range) |
|---|---|---|
| Red | 1.0~1.0 | 1.0~1.0 |
| Purple | -1.0~-0.75 | 0.1~0.6 |
| Green | -1.0~-0.95 | -1.0~-0.85 |
| Blue | 0.75~0.95 | -1.0~-0.65 |
| Light Gray | 1.0~1.0 | -1.0~-0.9 |
(f) Iteration 300
Figure 4: Evolution of karate club network node embeddings obtained from a GCN model after a number of semi-supervised training iterations. Colors denote class. Nodes of which labels were provided during training (one per class) are highlighted (grey outline). Grey links between nodes denote graph edges. Best viewed on a computer screen.
B EXPERIMENTS ON MODEL DEPTH
In these experiments, we investigate the influence of model depth (number of layers) on classification performance. We report results on a 5-fold cross-validation experiment on the Cora, Citeseer and Pubmed datasets (Sen et al., 2008) using all labels. In addition to the standard GCN model (Eq. 2), we report results on a model variant where we use residual connections (He et al., 2016) between hidden layers to facilitate training of deeper models by enabling the model to carry over information from the previous layer’s input:
$$ H ^ {(l + 1)} = \sigma \left(\tilde {D} ^ {- \frac {1}{2}} \tilde {A} \tilde {D} ^ {- \frac {1}{2}} H ^ {(l)} W ^ {(l)}\right) + H ^ {(l)}. \tag {14} $$
On each cross-validation split, we train for 400 epochs (without early stopping) using the Adam optimizer (Kingma & Ba, 2015) with a learning rate of 0.01. Other hyperparameters are chosen as follows: 0.5 (dropout rate, first and last layer), $\mathrm { \widetilde { 5 } \cdot 1 0 ^ { - 4 } : ( L 2 }$ regularization, first layer), 16 (number of units for each hidden layer) and 0.01 (learning rate). Results are summarized in Figure 5.
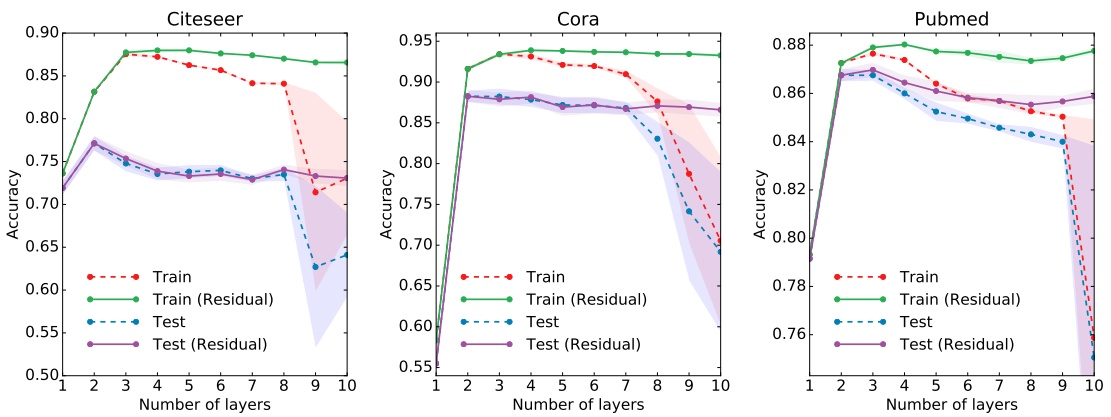
Figure 5: Influence of model depth (number of layers) on classification performance. Markers denote mean classification accuracy (training vs. testing) for 5-fold cross-validation. Shaded areas denote standard error. We show results both for a standard GCN model (dashed lines) and a model with added residual connections (He et al., 2016) between hidden layers (solid lines).
For the datasets considered here, best results are obtained with a 2- or 3-layer model. We observe that for models deeper than 7 layers, training without the use of residual connections can become difficult, as the effective context size for each node increases by the size of its $K ^ { \mathrm { t h } }$ -order neighborhood (for a model with K layers) with each additional layer. Furthermore, overfitting can become an issue as the number of parameters increases with model depth.